POWER USE · IRELAND · UPDATED SEPTEMBER 13, 2026
Ireland data-centre electricity use
Ireland’s Central Statistics Office publishes metered electricity consumption for data centres. It reports that they used 7,663 GWh in 2025, 23% of all metered electricity. In 2015 the share was 5%.
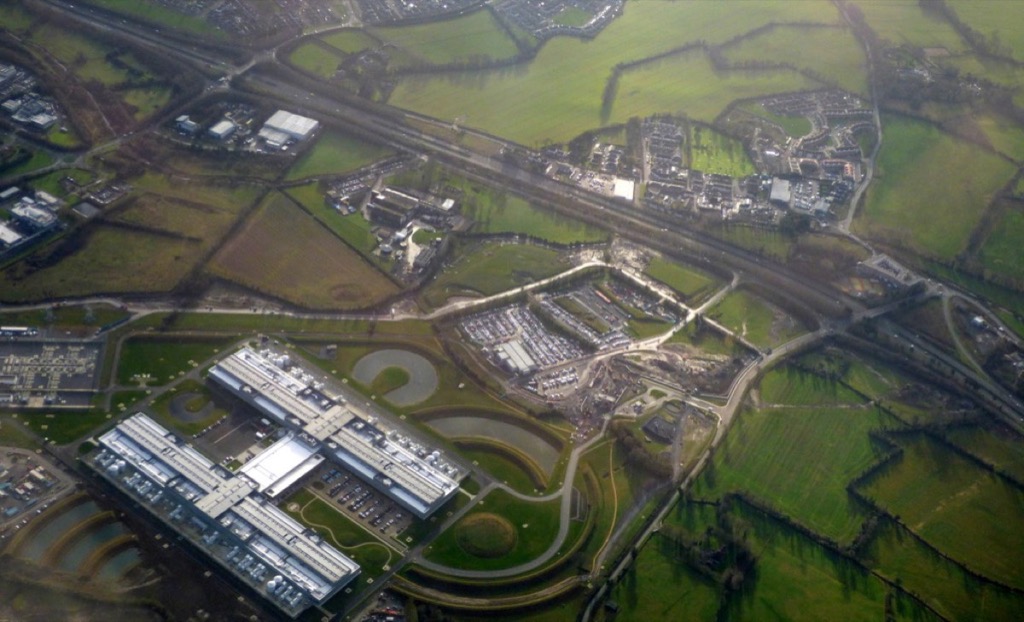
- 7,663 GWhData-centre metered electricity, 2025CSO Ireland
- 23%Share of total metered electricity, 2025 (5% in 2015)CSO Ireland
- +10%Data-centre growth in 2025, against +2% for all other usersCSO Ireland
- 28%Share used by all households, urban and rural, 2025CSO Ireland
Show the numbers
| PERIOD | DATA-CENTRE ELECTRICITY CONSUMPTION IN IRELAND, 2015–2025 (GWh) |
|---|---|
| 2015 | 1,240 |
| 2016 | 1,482 |
| 2017 | 1,762 |
| 2018 | 2,182 |
| 2019 | 2,490 |
| 2020 | 3,030 |
| 2021 | 4,012 |
| 2022 | 5,273 |
| 2023 | 6,339 |
| 2024 | 6,973 |
| 2025 | 7,663 |
Source: CSO Ireland ↗. CSO Table 1.
Consumption grew every year in the series, and was about 6.2 times higher in 2025 than in 2015 (calculated). The 2025 increase of 10% was slower than the jumps of 2021 (32%) and 2022 (31%) (calculated).
Show the numbers
| PERIOD | DATA CENTRES’ SHARE OF IRELAND’S METERED ELECTRICITY (%) |
|---|---|
| 2015 | 5 |
| 2016 | 6 |
| 2017 | 7 |
| 2018 | 8 |
| 2019 | 9 |
| 2020 | 11 |
| 2021 | 14 |
| 2022 | 18 |
| 2023 | 21 |
| 2024 | 22 |
| 2025 | 23 |
Source: CSO Ireland ↗. CSO Table 1, rounded to whole percentages by the CSO.
Data centres and households
In 2025, all residential electricity use, urban and rural, made up 28% of metered consumption, compared with 23% for data centres. Urban households used 18% and rural households 9%. The CSO also notes that household demand peaks in winter because of heating and lighting, while data-centre consumption tends to increase every quarter.
One campus in the numbers: Meta Clonee
Meta publishes annual electricity use for its campus at Clonee, County Meath. It is a single company-reported campus total, not a share of the national figure.
Show the numbers
| PERIOD | META CLONEE CAMPUS ELECTRICITY CONSUMPTION (MWh) |
|---|---|
| 2017 | 1,000 |
| 2018 | 200,000 |
| 2019 | 382,000 |
| 2020 | 487,000 |
| 2021 | 634,648 |
| 2022 | 668,290 |
| 2023 | 953,837 |
| 2024 | 1,076,961 |
Source: Meta ↗; Meta ↗. 2017–2019 from Meta’s 2023 report; 2020–2024 from its 2025 data index.
Clonee reported 1,076,961 MWh in 2024. See the Clonee record and sources →
Irish data centres on the map
The map holds 81 mapped data-centre records in Ireland. This is a count of mapped objects, not an official register.
Explore Irish data centres on the map ↗ Browse the Ireland directory →Frequently asked questions
How much electricity do data centres use in Ireland?
Ireland’s Central Statistics Office reports that data centres used 7,663 GWh of metered electricity in 2025, up 10% from 6,973 GWh in 2024.
What share of Ireland’s electricity goes to data centres?
Data centres accounted for 23% of Ireland’s total metered electricity consumption in 2025, up from 5% in 2015, according to the CSO. All residential consumption, urban and rural, accounted for 28%.
Are data centres growing faster than other electricity users in Ireland?
Yes. In 2025 data-centre consumption rose 10%, while consumption by all other users, including households and other businesses, rose 2%.
Sources
- CSO Ireland, Data Centres Metered Electricity Consumption 2025. Central Statistics Office, Ireland.
- Meta 2023 Sustainability Report, electricity table (PDF page 51). Meta.
- Meta 2025 Environmental Data Index, electricity table (PDF page 6). Meta.
Figures are quoted in their publishers’ units and scope. World, national, state, company and campus figures overlap and are never added together. Projections are labeled as projections; percentage changes marked “calculated” are simple arithmetic on the published values. All sources retrieved 13 September 2026. Methodology