POWER USE · COMPANIES · UPDATED SEPTEMBER 13, 2026
Google and Meta data-center electricity
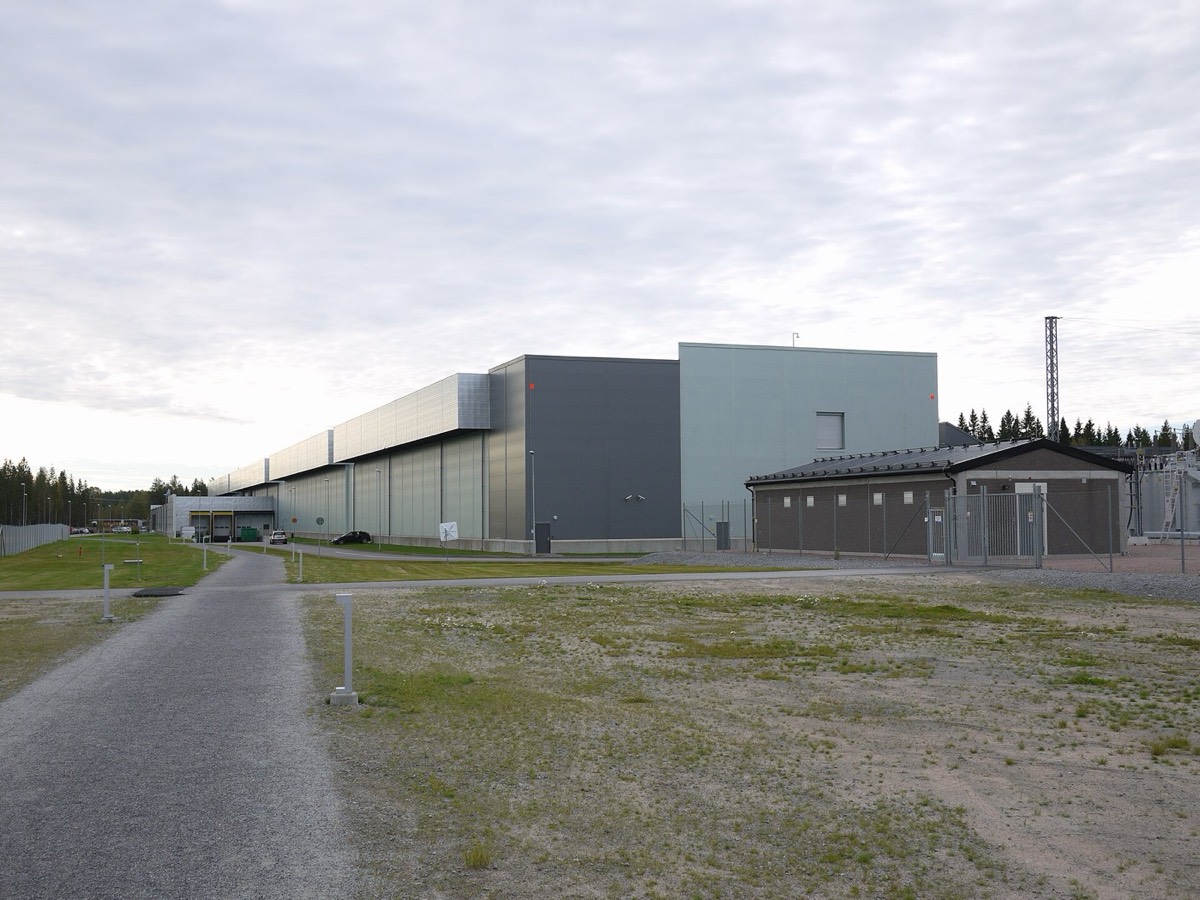
Google and Meta both publish annual data-center electricity use in their sustainability reports. Google’s data centers used 42.4 TWh in 2025, 38% more than a year earlier. Meta’s used 18.1 TWh in 2024, 21% more than in 2023. Both percentages are calculated from the reported values.
- 42.4 TWhGoogle data centers, 2025Google
- 2.4×Google data-center electricity, 2025 compared with 2021 (calculated)Google
- 18.1 TWhMeta data centers, 2024Meta
- 7.7×Meta data-center electricity, 2024 compared with 2017 (calculated)Meta
- Meta
Show the numbers
| YEAR | GOOGLE (TWh) | META (TWh) |
|---|---|---|
| 2017 | Not reported | 2.4 |
| 2018 | Not reported | 3.2 |
| 2019 | Not reported | 4.9 |
| 2020 | Not reported | 7.0 |
| 2021 | 17.4 | 9.1 |
| 2022 | 20.6 | 11.2 |
| 2023 | 24.0 | 15.0 |
| 2024 | 30.6 | 18.1 |
| 2025 | 42.4 | Not reported |
Source: Google ↗; Meta ↗; Meta ↗. Google’s table starts in 2021; Meta’s latest published year is 2024. Company methods differ, so compare trends rather than treating the two as one market total.
Meta’s campuses, ranked
Meta lists electricity use by campus. In 2024, 17 campuses reported a value, adding up to 14.9 TWh (calculated). Each name links to the campus record on our map with its full year-by-year table.
Source: Meta ↗. Campus totals are consumption, not rated capacity. Kansas City first appears in 2024.
The newest campuses show the build-out clearly. Gallatin reported 0 MWh in 2021 and 359,730 MWh in 2024; DeKalb went from 4,724 MWh to 372,339 MWh over the same years.
Efficiency: Google’s PUE
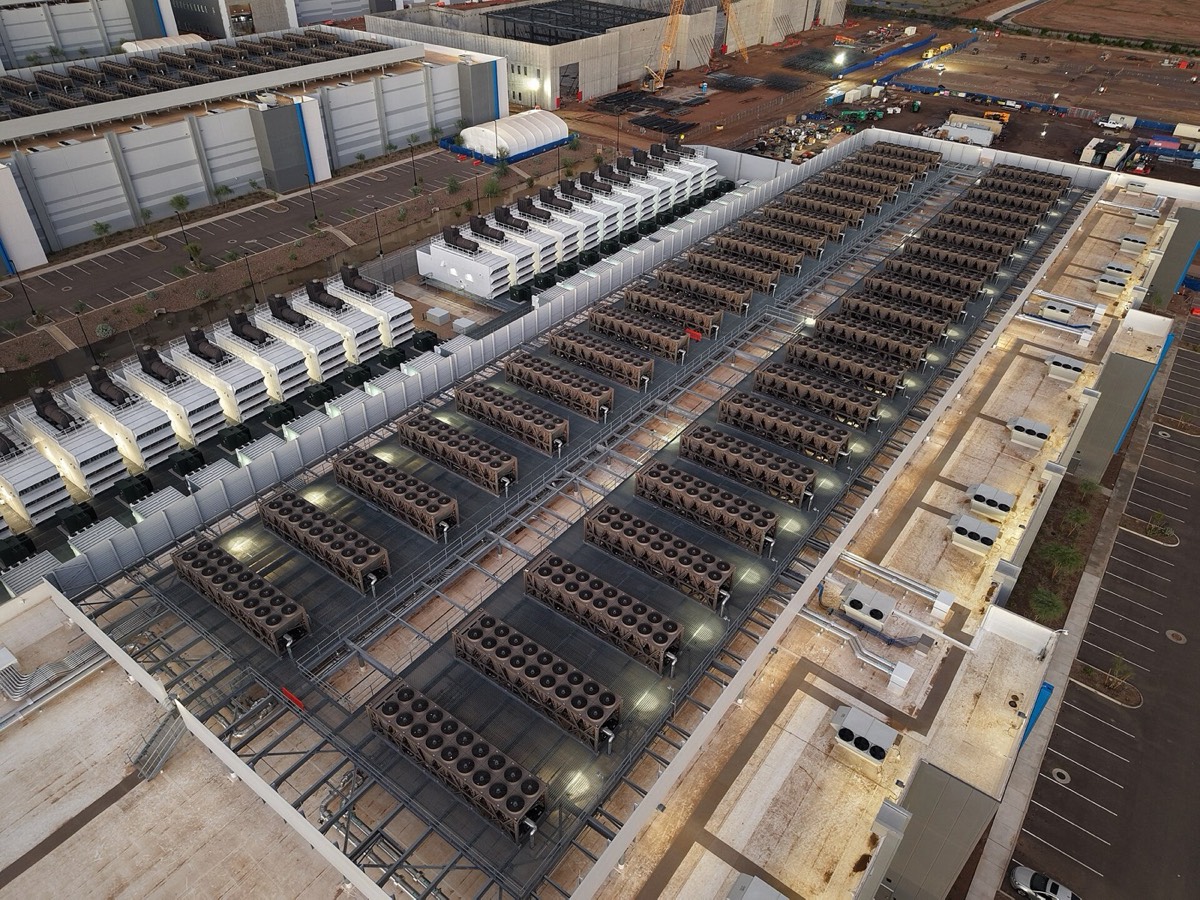
Power usage effectiveness (PUE) compares a data center’s total energy use with the energy used by IT equipment. Google reports a 2025 fleet-wide average PUE of 1.09. It compares this with Uptime Institute’s 2025 survey average of 1.54, and says its data centers use 83% less overhead energy. A lower PUE means less energy for cooling and power conversion. It does not reduce the electricity used by the servers themselves.
- 1.09Google fleet-wide average PUE, 2025Google
- 1.54Average PUE of Uptime Institute survey respondents, 2025Google
Google and Meta on the map
Both companies’ facilities appear on the map with their sources. Mapped counts are object counts, not official fleet sizes.
Google data centers on the map ↗ Meta data centers on the map ↗Frequently asked questions
How much electricity do Google’s data centers use?
Google’s 2026 Environmental Report lists 42,415,800 MWh (42.4 TWh) of data-center electricity consumption in 2025, up from 17,429,800 MWh in 2021.
How much electricity do Meta’s data centers use?
Meta reported 18,061,781 MWh (18.1 TWh) for its data centers in 2024, up from 2,360,000 MWh in 2017.
Which Meta data center uses the most electricity?
In 2024, Meta Prineville reported the highest consumption of Meta’s listed campuses: 1,728,291 MWh, followed by Meta Altoona with 1,585,392 MWh.
How efficient are Google’s data centers?
Google reports a 2025 fleet-wide average power usage effectiveness (PUE) of 1.09. Uptime Institute’s 2025 survey found an average of 1.54 among respondents’ data centers.
Sources
- Google 2026 Environmental Report, electricity table (PDF page 93). Google, 2026-06-30.
- Google Data Centers: Power usage effectiveness. Google.
- Meta 2023 Sustainability Report, electricity table (PDF page 51). Meta.
- Meta 2025 Environmental Data Index, electricity table (PDF page 6). Meta.
Figures are quoted in their publishers’ units and scope. World, national, state, company and campus figures overlap and are never added together. Projections are labeled as projections; percentage changes marked “calculated” are simple arithmetic on the published values. All sources retrieved 13 September 2026. Methodology