POWER USE · UPDATED SEPTEMBER 13, 2026
How much electricity do data centers use?
Data centers worldwide used an estimated 485.1 TWh of electricity in 2025, according to the International Energy Agency. That is 17% more than in 2024, while global electricity demand grew 3%. In the IEA’s base case, consumption roughly doubles to 945 TWh by 2030, around 3% of global electricity demand.
- 485 TWhWorld data-center electricity use in 2025Estimate · IEA
- +17%Growth in 2025, against +3% for all electricity demandIEA
- 945 TWhProjected use in 2030IEA base case · IEA
- 23%Share of Ireland’s metered electricity used by data centres, 2025CSO Ireland
- 4.4%Share of US electricity used by data centers, 2023Berkeley Lab
- Estimate
- Projection
Show the numbers
| PERIOD | WORLD DATA-CENTER ELECTRICITY CONSUMPTION, 2020–2030 (TWh) |
|---|---|
| 2020 | 269.1 |
| 2021 | 297 |
| 2022 | 324.1 |
| 2023 | 360.4 |
| 2024 | 415.6 |
| 2025 | 485.1 |
| 2026 (projection) | 560 |
| 2027 (projection) | 664.4 |
| 2028 (projection) | 773 |
| 2029 (projection) | 862.4 |
| 2030 (projection) | 945 |
Source: IEA ↗. Excludes cryptocurrency mining and data transmission networks. The IEA’s 2026 summary rounds the 2030 value to 950 TWh.
The estimate rose 80% between 2020 and 2025 (calculated from the IEA values). Growth has also accelerated: the IEA put average growth at 12% per year over the five years to 2024, then 17% in 2025 alone.
How big is that?
In 2024, data centers used about 1.5% of global electricity. The IEA expects that share to reach around 3% by 2030. It describes its 2030 projection as “slightly more than Japan’s total electricity consumption today.”
Data centers are still not the main driver of global demand. In the IEA base case they account for less than 10% of global electricity demand growth between 2024 and 2030. Industrial growth and electrification, electric vehicles and air conditioning lead the way. Growth is concentrated in a few places, though, so some local grids feel much more pressure.
Where data-center electricity is used
Source: IEA ↗. “Rest of world” is the remainder after the three shares the IEA publishes.
Source: IEA ↗. China and the United States account for nearly 80% of projected global growth.
Why demand is rising: AI
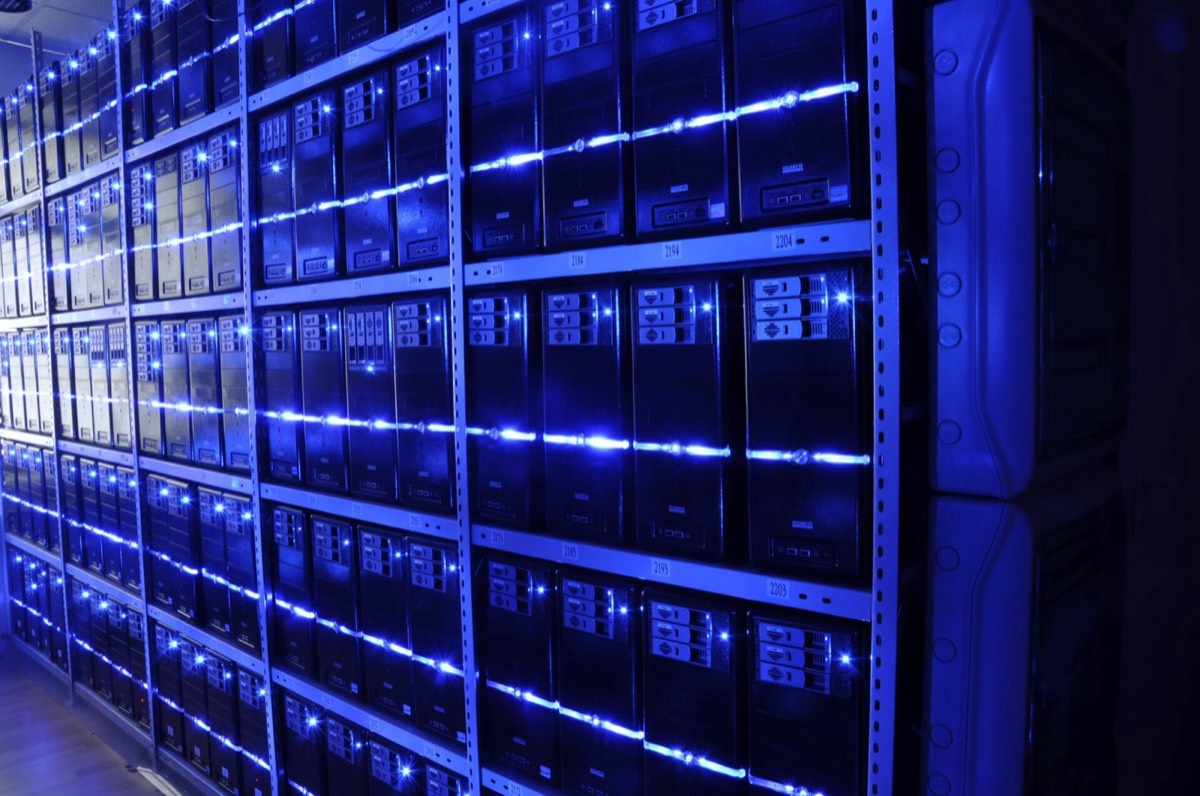
The IEA reports that electricity use by AI-focused data centers grew 50% in 2025 and is projected to triple between 2025 and 2030. Electricity use in accelerated servers, growth mainly driven by AI adoption, is projected to rise 30% a year and accounts for almost half of the projected net increase.
Hardware is getting denser: AI server power density increased 11 times between 2020 and 2025. Five large technology companies spent more than USD 400 billion in capital expenditure in 2025, with a further 75% increase expected in 2026.
Efficiency is improving too. The IEA says energy use per AI task has dropped by at least an order of magnitude a year recently, and a simple text query now typically uses less electricity than running a television for the same length of time. Read the AI electricity guide →
Local grids feel it first

Global shares hide heavy concentration. In Ireland, official metered data show data centres used 23% of metered electricity in 2025, up from 5% in 2015. All households together used 28%. Ireland data →
In the United States, EPRI estimated that 15 states accounted for 80% of national data-center load. In Virginia, the state with the largest estimated data-center load, data centers used an estimated 25.6% of state electricity in 2023. US data →
What companies report
- Meta
Show the numbers
| YEAR | GOOGLE (TWh) | META (TWh) |
|---|---|---|
| 2017 | Not reported | 2.4 |
| 2018 | Not reported | 3.2 |
| 2019 | Not reported | 4.9 |
| 2020 | Not reported | 7.0 |
| 2021 | 17.4 | 9.1 |
| 2022 | 20.6 | 11.2 |
| 2023 | 24.0 | 15.0 |
| 2024 | 30.6 | 18.1 |
| 2025 | 42.4 | Not reported |
Source: Google ↗; Meta ↗; Meta ↗. Meta’s 2025 value is not in the cited reports. Company figures are part of worldwide data-center use, not additions to the IEA estimate.
Google’s data centers used 42.4 TWh in 2025, 38% more than in 2024 (calculated). Meta’s used 18.1 TWh in 2024, 21% more than in 2023 (calculated). Company and campus data →
Efficiency: what PUE says
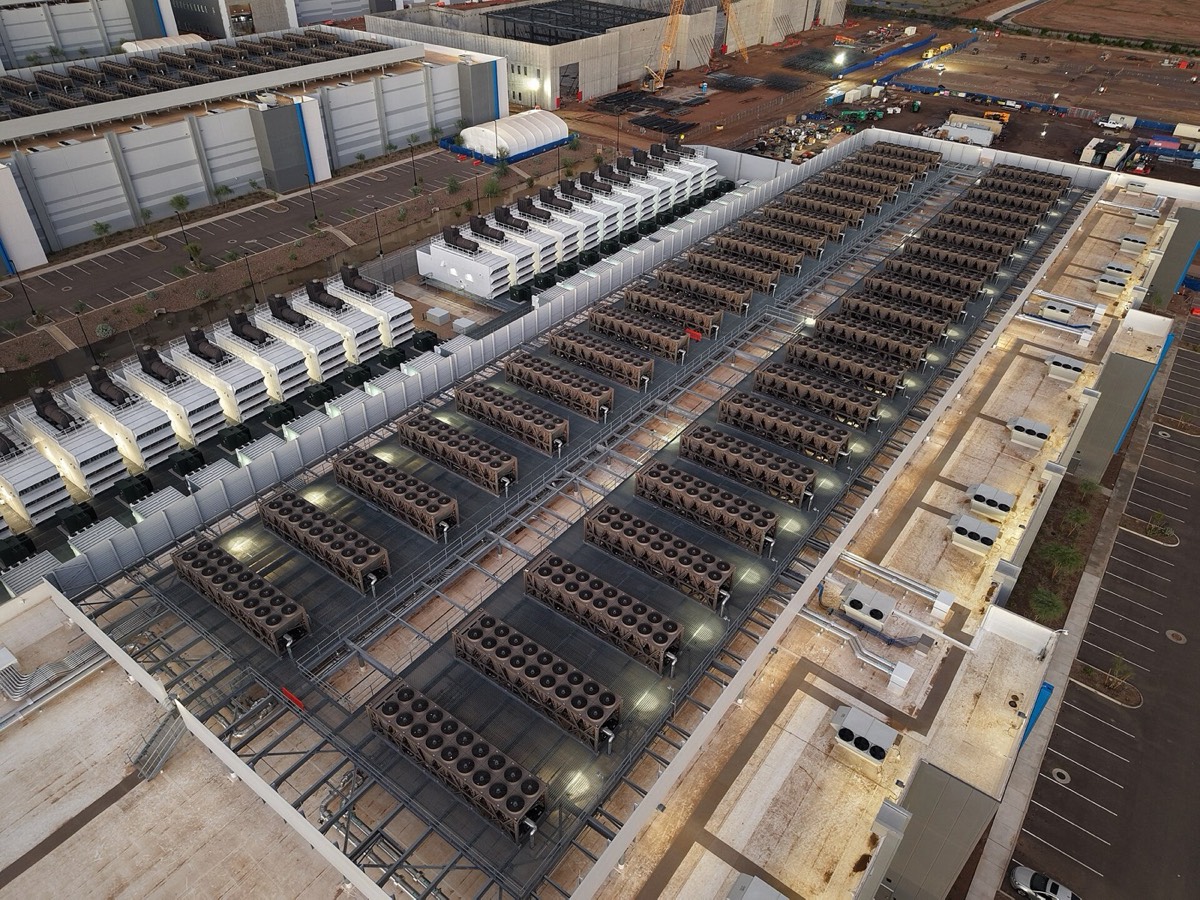
Power usage effectiveness (PUE) divides a data center’s total energy use by the energy used by its IT equipment. The rest goes on cooling, power conversion and other overheads. Uptime Institute’s 2025 survey found an average PUE of 1.54 among respondents’ data centers. Google reports a 2025 fleet average of 1.09, which it says means 83% less overhead energy than the industry average.
How the power is being supplied
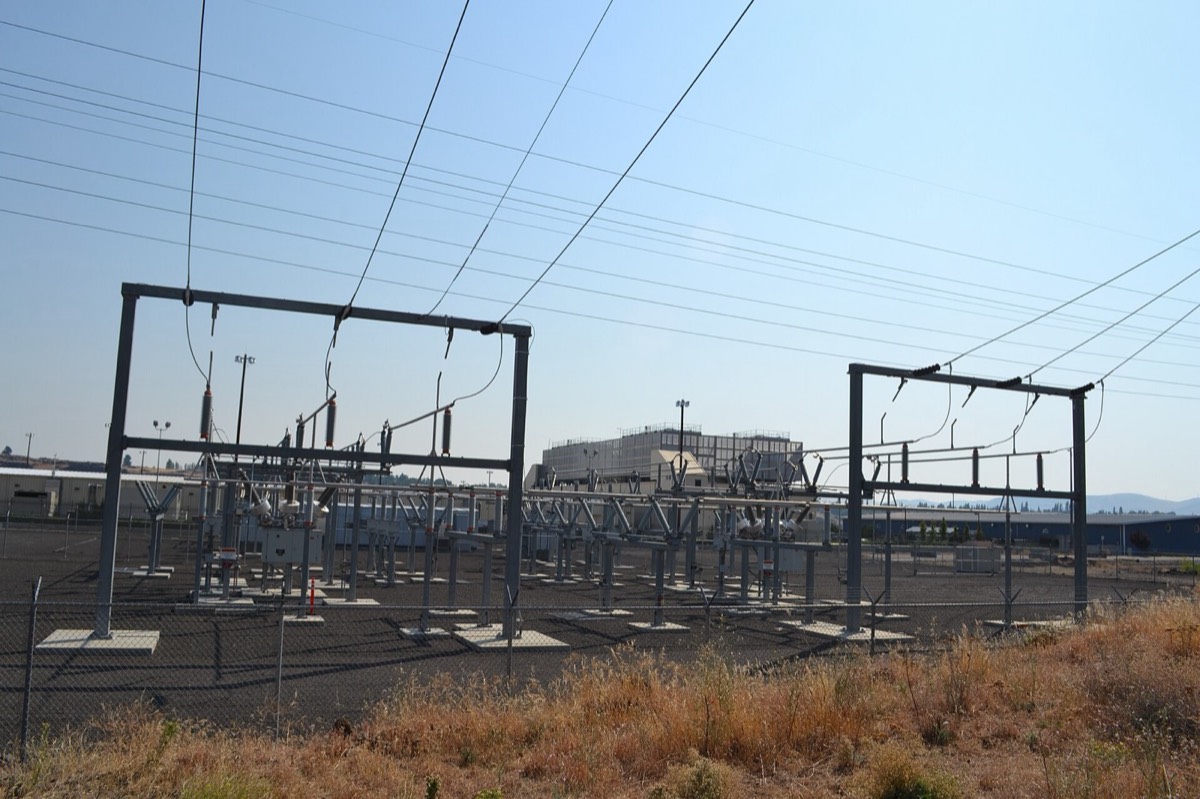
- ~40%Tech sector’s share of corporate renewable PPAs signed in 2025IEA
- 45 GWConditional data-center offtake agreements with small modular reactor projects, up from 25 GW at the end of 2024IEA
- 15–27 GWOnsite natural gas that may power data centers by 2030IEA
- 20–25 GWBattery storage that could be installed in data centers by 2030IEA
Supply chains are tight. The IEA notes a 70% surge in gas turbine orders in 2025. In its projections, emissions associated with data centers double to around 350 million tonnes by 2035, still about 2% of global electricity-sector emissions.
Explore data centers on the map ↗Frequently asked questions
How much electricity do data centers use?
The International Energy Agency estimates that data centres worldwide used 485.1 TWh of electricity in 2025, up from 269.1 TWh in 2020. In 2024 they used about 1.5% of the world’s electricity.
Is data-center electricity use rising?
Yes. The IEA says global data-centre electricity demand grew by 17% in 2025, while total global electricity demand grew by 3%. Its base case projects 945 TWh in 2030, roughly double the 2025 level and around 3% of global electricity demand.
How much of data-center electricity growth comes from AI?
The IEA says electricity consumption from AI-focused data centres grew 50% in 2025 and is projected to triple between 2025 and 2030. Electricity use in accelerated servers, growth the IEA says is mainly driven by AI adoption, is projected to rise 30% a year and accounts for almost half of the projected net increase in data-centre electricity consumption.
Which country uses the most electricity for data centers?
The United States. The IEA estimates it accounted for 45% of global data-centre electricity consumption in 2024, followed by China (25%) and Europe (15%).
What share of electricity do data centers use in Ireland and Virginia?
Ireland’s Central Statistics Office measured data centres at 23% of metered electricity consumption in 2025. EPRI estimated that data centers used 25.6% of Virginia’s electricity in 2023.
What is PUE?
Power usage effectiveness is a data center’s total energy use divided by the energy used by its IT equipment. A PUE of 1.54, the 2025 average reported by Uptime Institute survey respondents, means 0.54 units of cooling and other overhead energy for every unit used by IT equipment. Google reports a 2025 fleet average of 1.09.
Sources
- IEA (2026), Electricity consumption by data centres, 2020–2035. International Energy Agency, 2026-04-16. CC BY 4.0.
- IEA (2026), Key Questions on Energy and AI — Executive summary. International Energy Agency, 2026. CC BY 4.0.
- IEA press release: Data centre electricity use surged in 2025. International Energy Agency, 2026-04-16.
- IEA (2025), Energy and AI — Executive summary. International Energy Agency, 2025. CC BY 4.0.
- IEA (2025), Energy and AI — Energy demand from AI. International Energy Agency, 2025. CC BY 4.0.
- Berkeley Lab (2024), United States Data Center Energy Usage Report. Lawrence Berkeley National Laboratory for the U.S. Department of Energy, 2024-12-20.
- CSO Ireland, Data Centres Metered Electricity Consumption 2025. Central Statistics Office, Ireland.
- EPRI (2024), Powering Intelligence, Table 2 (PDF page 13). Electric Power Research Institute, 2024-05.
- Google 2026 Environmental Report, electricity table (PDF page 93). Google, 2026-06-30.
- Google Data Centers: Power usage effectiveness. Google.
- Meta 2023 Sustainability Report, electricity table (PDF page 51). Meta.
- Meta 2025 Environmental Data Index, electricity table (PDF page 6). Meta.
Figures are quoted in their publishers’ units and scope. World, national, state, company and campus figures overlap and are never added together. Projections are labeled as projections; percentage changes marked “calculated” are simple arithmetic on the published values. All sources retrieved 13 September 2026. Methodology